One of the key choices a Trader has to make is the choice of the Timeframe for a Trade. And if you’re trading Options, this basically comes down to the choice of expiry of the Option series.
However, using the Multi Time Frame Trend indicator, you can actually pinpoint exactly what sort of timeframe you should choose, which in turn will vastly simplify the choice of Expiry series. On a short-term chart, a Stock may be bearish or neutral, however if you can get a comprehensive visual view of Multiple time frames and their trends, you may realize the Stock is actually Bullish on a 4 hour chart or a 1 Day chart. The Multi Time Frame Trend indicator makes this job extremely simple.
Assume you have 4 Chart panes on your platform. The Multi Time Frame Trend indicator (MTFT) can plot up to 5 Timeframes on each chart. This gives you 20 Views of a Stock’s trend in one shot.
GOOGL Charts – Bullish or Bearish
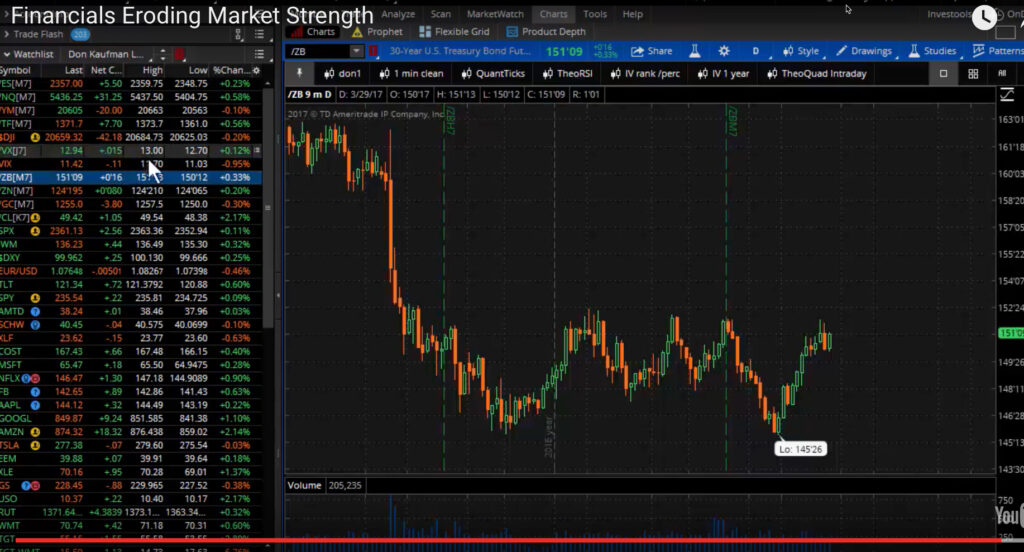
To illustrate this point, this video discuses GOOGL with a 4-pane chart. Clearly in the short run (5 minutes and 30 minutes), GOOGL looks Bearish to Neutral at best. However, if you study the 4-hour chart, we see a strong Bullish pattern, which is also supported by the Daily chart.
WITH THIS INSIGHT, YOU CAN NARROW DOWN YOUR TRADE TO A 30-DAY OPTION SERIES, WITH THE INTENTION OF HOLDING THE TRADE FOR ABOUT 4 TO 6 DAYS.THIS IS POWERFUL.
Please watch this video for this analysis.