SPX Double Top Pattern could be Bearish
The video below analyzes the SPX Futures instrument (/ES) over the medium term as well as the Long term. If you look at the 1 Year Daily chart of the /ES, you’ll clearly see a Double Top established first in Sep / Oct of 2018, and then again last month in April 2019. Please check the image below.
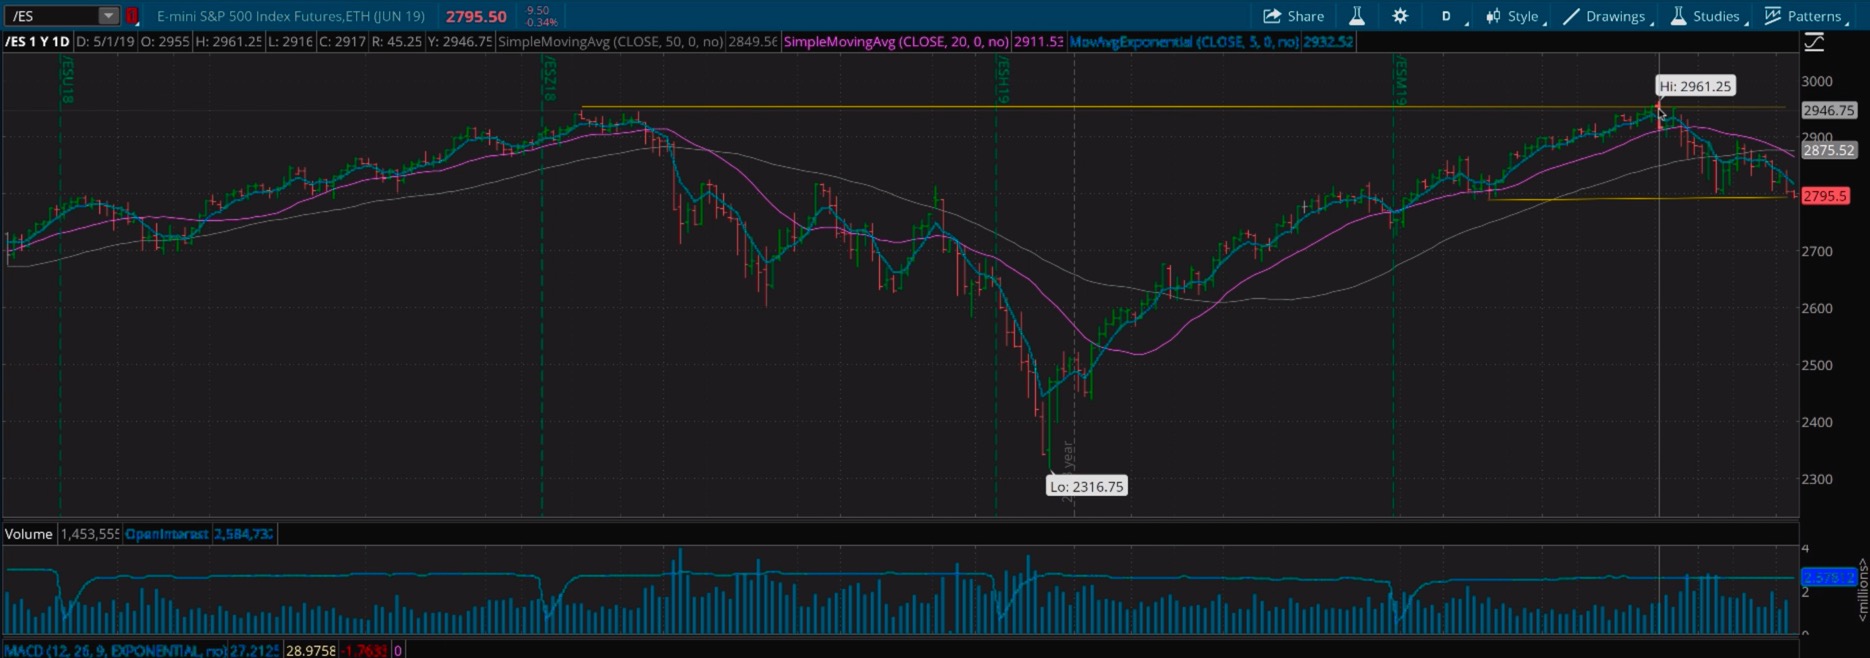
Why the Double Top pattern is Bearish
A Double Top pattern is Bearish because traders have provided resistance at that level before, and when they see the same levels again, they step in with strong resistance again. For the double top to be established, there needs to be validation, which is provided by an analysis of a series of either Higher Highs and Higher Lows, or in the case of a reversal pattern, it will be Lower Highs and Lower Lows. The first validation came around May 15th 2019, when the first Lower High was established, and now a Lower Low is in the process of being established. The current levels are key because if these don’t hold, we could see a lot more downside.
Historical significance of Double Tops
This pattern developing today is of significant importance because Double Tops have proven to be powerful bearish indicators in the past. The video below looks at this historical significance. Please feel free to send your thoughts to [email protected].
Best
Hari Swaminathan